Jono Nourse
- 30 Jul, 2026
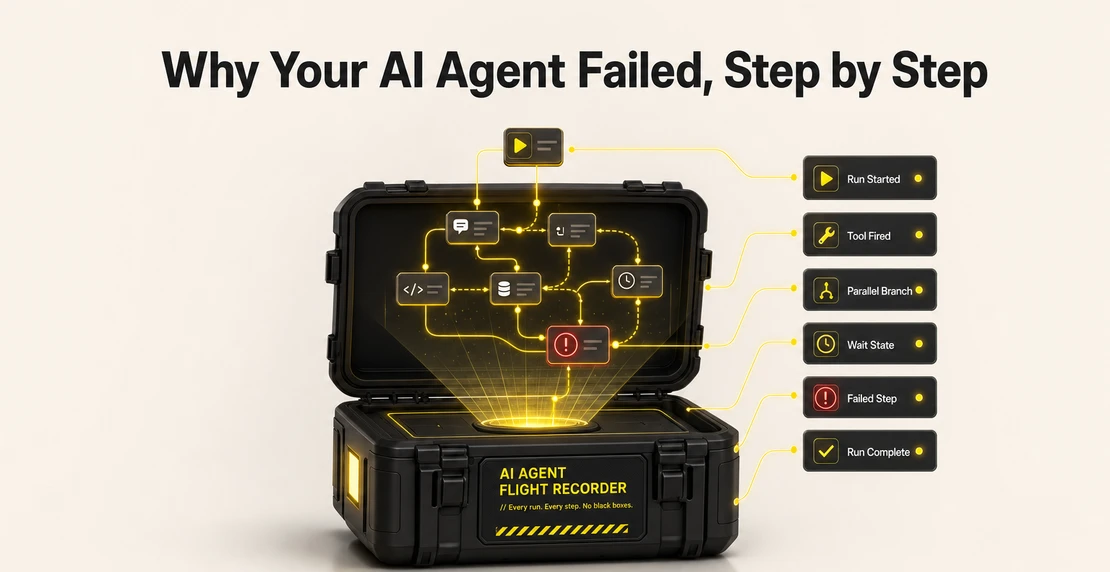
Why Your AI Agent Failed, Step by Step
AI agents fail in ways that never show up in a single LLM call: wrong tool choices, malformed arguments, stale retrieval, dropped context in handoffs. …
Read article
Jono Nourse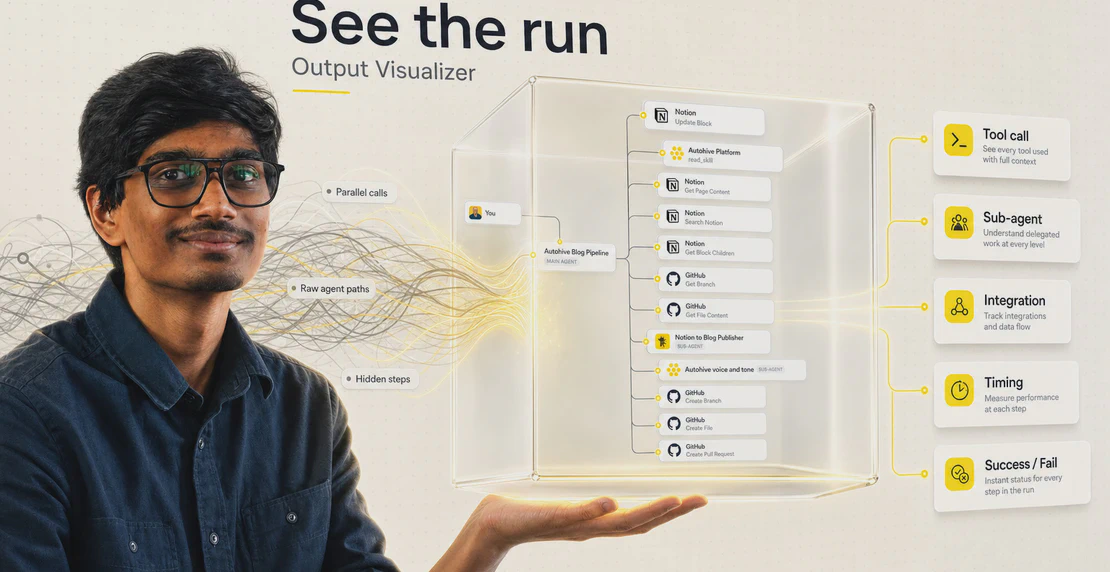
We spoke with Autohive developer Risheet Peri about what the Visualizer shows, why it exists, and how to use it when an agent is slow or behaving in ways you didn’t expect.
When the Output Visualizer shipped, we did what any sensible team does when a feature has a good story behind it: we asked the person who built it to explain it. Risheet Peri is one of the Autohive engineers who designed and built the feature. This is that conversation.
The Output Visualizer renders any agent run as a live, node-based execution tree. You can see every tool call, sub-agent handoff, and integration action, with timing and success/failure states on each node. It reads events the platform already captures, so it adds no token cost and no extra database load. Desktop only for now. Keyboard shortcut: Alt + Shift + V on Windows, Option + Shift + V on Mac.
If you haven’t read Why Your AI Agent Failed: Step by Step, it is worth your time before going further.
Short version of that post: Agent opacity is a production problem. When an agent fails or takes too long, most users have no way to tell where in the chain things went wrong. The post walks through why agent runs fail and why the lack of visibility makes debugging complex agent runs frustrating. The Output Visualizer is the direct practical response to that problem.
This interview picks up where that post left off.
Q: Let’s start with the basics. What does the Output Visualizer show?
Risheet: It renders the execution of a run as a tree. Your prompt goes in, hits the main agent, and from there you can see every call that branches off: tool calls, sub-agent calls, and integration actions. Each node shows how long it took and whether it succeeded or failed. So instead of watching a spinner and waiting, you can see exactly where the run is and what it’s done so far.
Q: What were you trying to fix when you built it?
Risheet: The existing chat view already shows tool call activity, but it doesn’t really give you depth or structure. With a multi-agent setup, you could see that something was happening, but you couldn’t tell where in the chain it was happening or how deep you were. If one call was taking two minutes, you had no way to know which call without guessing. That’s what the Visualizer makes visible.
Q: Who does it help most?
Risheet: Anyone who’s built a multi-agent setup and wants to understand what’s going on inside it. That could be someone technical trying to tune performance, or someone who’s not technical at all but wants to understand why their agent took four minutes. For beginners especially, it makes the abstract concrete. You can see an agent call a sub-agent, then that sub-agent make an integration call, and you immediately understand where in the chain a specific action happens. That’s hard to explain in documentation. The Visualizer just shows it.
Q: What does it show that the regular tool call display doesn’t?
Risheet: Depth and structure. You can see parallel branches running side by side. You can see how many layers deep a call goes. You can see exactly which step is the bottleneck. The regular activity feed tells you something happened. The Visualizer tells you where it happened and what it cost in time.
Q: You mentioned parallel agents. Can you walk through a practical example?
Risheet: Say you’ve got four agents running in parallel and the run finishes, but it took longer than expected. Without the Visualizer, you’d have no idea which of the four was the slow one. With it, you can see all four branches at once, compare the timings, and spot the outlier. You might also notice that you’ve got four agents doing a job that two could handle, and that extra overhead is slowing the whole thing down. That kind of unintended behavior is easy to miss until you can actually see the structure.
Q: Does it help with performance tuning?
Risheet: Yes, that’s one of the cleaner use cases. If a tool call is taking a minute or more, that’s your signal to look at the prompt driving it. Agents often take longer because they’re exploring different paths before they land on the right one. A more direct prompt cuts that exploration time down. So you use the Visualizer to find where the time is going, then use Prompt Writer or Ask Autohive to tighten up that part of the workflow.
Q: Can you explain what you mean by an agent exploring paths?
Risheet: When a prompt is vague, the agent has to do more work to figure out what you want. It might try one approach, find it doesn’t fit, backtrack, and try another. That back-and-forth shows up as extra steps in the tree. The more specific and direct the prompt, the fewer detours the agent takes.
Model choice plays into this too. If you want to understand how your model selection affects run time, this post on choosing the right AI model goes into the tradeoffs in detail. And if you’re running multiple agents on different tasks, this piece on not using one model for everything is worth reading alongside it.
Q: Does the Visualizer show which model an agent is using?
Risheet: Not right now. The execution tree shows what happened and when. It doesn’t show which model handled each node. Model visibility could be a useful addition later, but it’s not there yet.
Q: You’ve said it adds no token cost. How does that work?
Risheet: The Visualizer reads application events that the platform is already receiving as the run happens. It doesn’t make any additional LLM calls, and it’s not putting new load on the database. It’s observing what’s already there and rendering it in a way you can actually read. That means no added tokens and no added cost.
Q: It’s desktop-only for now. Why?
Risheet: The execution tree needs horizontal space. Mobile screens are portrait by default, and the aspect ratio doesn’t work well for displaying a branching structure with timing on every node. Getting it right on mobile would take real design work. For now it’s desktop only, but that’s a scoping call, not a permanent one.
Q: Any practical advice for someone looking at the tree and seeing something unexpected?
Risheet: Start by finding the slowest node. If one call is dominating the run time, that’s where you investigate first. Then bring in Ask Autohive or Prompt Writer to figure out whether the prompt can be sharpened. Prompt Writer is good for writing a first prompt from scratch if you’re starting fresh, and it’s just as useful for refining an existing one when an agent is being too slow or too vague. The Visualizer gives you the signal. Those tools help you act on it.
Multi-agent systems are genuinely hard to debug. Most monitoring tools tell you whether a job completed. They don’t tell you what happened inside. Step-level visibility into what an agent actually did has historically required engineering teams with the time and tooling to set up custom tracing. It’s not something most users building agents in a no-code platform can access.
The Output Visualizer puts that visibility directly in the Autohive interface. There’s no setup, no extra cost, and no technical background needed to read it.
The goal was straightforward: if you build an agent and something goes wrong or takes too long, you should be able to see where. You don’t need to dig through logs or guess at the cause. Open a panel and see the run laid out like a map showing you the route.
The launch blog post describes the problem. The Output Visualizer is what doing something about it looks like.

Written by
Jono is the Marketing Operations Lead at Autohive, bridging the gap between commercial strategy and AI-powered execution. With a passion for building systems that scale, he brings structure to complexity and turns marketing activity into measurable …
Jono NourseAI agents fail in ways that never show up in a single LLM call: wrong tool choices, malformed arguments, stale retrieval, dropped context in handoffs. …
Read article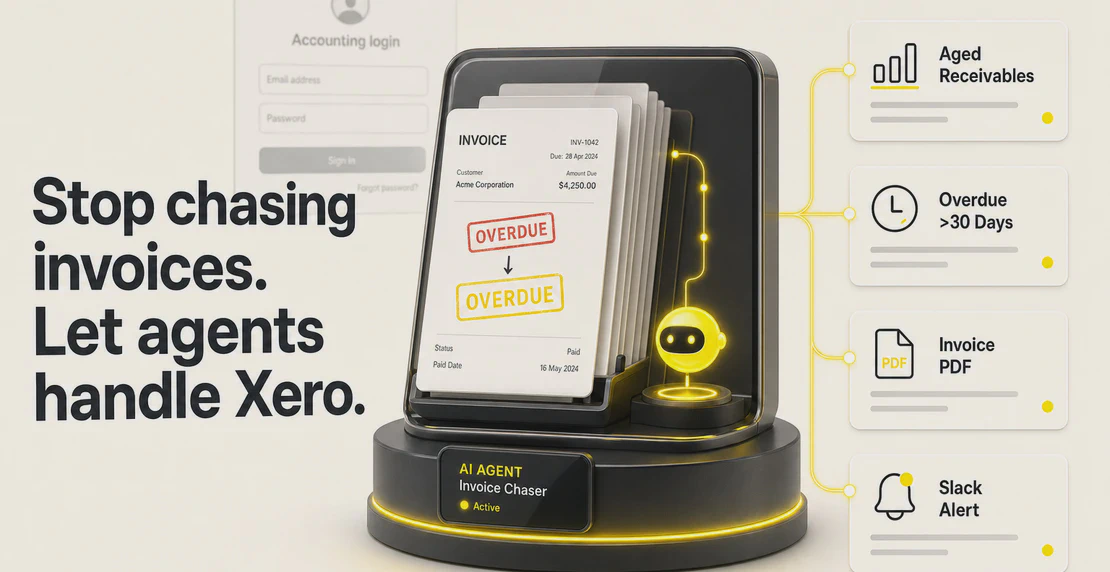 Jono Nourse
Autohive's new Xero integration puts 26 actions in the hands of custom AI agents, from chasing overdue invoices to running scheduled financial …
Read article