You send a prompt. An answer comes back. Between those two moments, you have no idea what happened.
For a simple chatbot, that gap is small enough to ignore. You asked a question, the model answered it, and the surface area for failure is limited. Agents work differently. An agent might search the web, call an API, query a database, hand work off to a sub-agent, retry a failed step, and make a dozen decisions before writing the output you see. All of that happens out of view.
This is the black box problem, and with AI agents it cuts deeper than most people expect.
Why agents are harder to inspect than a single LLM call
When you call a language model directly, there is one input and one output. If the response is wrong, you have a manageable set of explanations: the prompt was unclear, the context was thin, the model made an error. The failure space is bounded.
Agents compound this. A multi-step agent might select a tool, form arguments for that tool, execute it, interpret the result, decide whether to continue or retry, pass state to another agent, and only then write a response. Each of those steps is a decision point. An error at step two does not fail loudly. It propagates. By the time it reaches step six, the output can look entirely plausible while being built on something that went wrong early.
IBM defines black box AI as systems where users see inputs and outputs but not the internal reasoning or operations connecting them. With agents, what sits between those two endpoints is far more complex than a single inference pass.
What invisible failures actually look like
The tricky part is that agent failures often do not look like failures. The agent returns a response. It is coherent, formatted correctly, nothing crashed. But something went wrong in the middle.
Some common AI agent failure modes:
- The agent selected the wrong tool, then used its output to reason forward.
- Arguments passed to a tool were malformed. The tool returned empty. The agent treated silence as a valid answer.
- Retrieved context was stale or polluted, and the model responded confidently from bad data.
- A retry loop ran several times before producing a result that looked like a clean first attempt.
- In a multi-agent flow, a handoff dropped context. The receiving agent started from an incomplete state.
From the outside, these look like clean runs. The only signal something went wrong might be a slightly odd answer, a response that arrived slower than expected, or in some cases, nothing unusual at all.
Monitoring tells you something happened. Observability tells you why.
Monitoring captures state: a run completed, an error was thrown, latency was high. Autohive’s notifications work at this level. They’ll tell you a run finished, failed, or is waiting on you. That’s useful, but it stops at the surface.
AI agent observability captures the path: which tools fired, in what order, what they returned, how long each step took, where the plan shifted.
For agents, the gap between monitoring and observability is where debugging time disappears.
Braintrust’s work on agent observability and tool call tracing makes the case that without step-level visibility, debugging agent failures becomes guesswork. Teams end up tweaking prompts and swapping models when the actual problem is a broken integration, stale retrieval, or a sub-agent receiving incomplete context. Without visibility into the execution path, you are diagnosing by elimination.
LangChain’s agent observability documentation identifies the core data that matters: LLM calls, tool calls, retrieval steps, reasoning transitions, and state changes. These are the joints of any agent run. Without visibility into them, it is easy to misattribute failures to model quality when the real issue is a broken handoff or bad retrieval. If you have been second-guessing your model choice based on unexpected outputs, this post on choosing the right AI model is worth reading with that framing in mind, and so is this one on why a single model rarely fits every task.
The broader industry is catching up. OpenTelemetry’s GenAI semantic conventions are standardizing telemetry for AI systems. AI agent execution tracing is being treated the same way distributed system tracing is: a baseline requirement, not an optional add-on.
Why visibility affects whether teams actually deploy agents
There is a clear operational reason teams hesitate to run autonomous agents on anything consequential: they cannot see what is happening, so they cannot trust the output, and they cannot explain the result if something goes wrong.
Debugging is one part of this. Trust is another. Teams with no visibility into agent activity end up supervising agents manually, checking every output by hand, treating the whole system as a source of plausible but possibly wrong answers. If every output needs manual verification, you have not automated the work. You have added a layer between the human and the result.
Accountability is the third piece. If an agent makes a consequential decision in a business process, the people responsible for that process need to be able to reconstruct what happened. An AI agent audit trail is not optional once agents are doing real work. It is what makes real work possible.
Multi-agent flows, scheduled automations, and chained workflows all increase the surface area for this problem. More agents means more handoffs, and more places an error can hide inside a clean-looking result.
What the Agent Visualizer does
Autohive just shipped the Agent Visualizer to all plans.
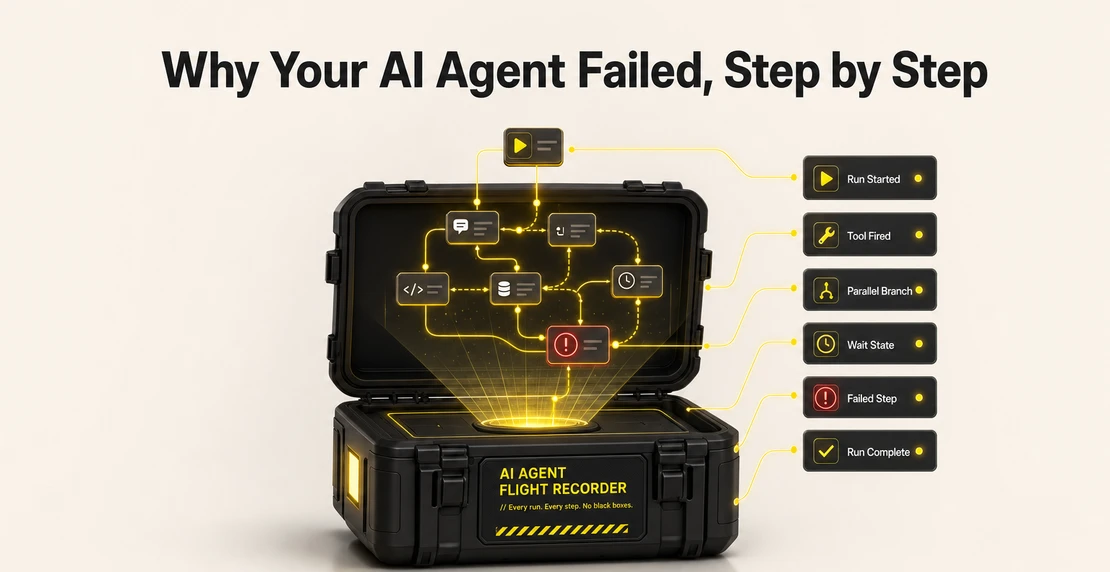
The feature renders each conversation run as a node-based execution map. The user prompt flows into the main agent, which branches out into tool calls and integration actions. Each node shows the agent or integration involved, its execution status, and timing. The connections between parent and child actions are drawn explicitly, so you can follow the actual path the run took rather than inferring it from the output.
A compact, linear run looks different from a branching run with several integration calls firing in parallel. Both are visible in the map. You can see where time was spent, which steps connected to which, and what the structure of the run actually was.
Building a custom agent involves iteration: you test, something behaves unexpectedly, you adjust. The Visualizer gives that loop something concrete to work from. Rather than re-running an agent and hoping the output changes, you can look at the execution map and identify where to intervene.
The same applies in production. Scheduled agents running automated jobs (here’s how to set one up if you haven’t yet) are not supervised in real time. Knowing a run completed is useful. Knowing how it completed, which steps it took, and what the branching looked like is what gives you the confidence to leave it running.
Try it now
The Agent Visualizer is live on all Autohive plans. Open any conversation and look at your next run. If you are running multi-agent setups, workflows across multiple integrations, or scheduled automations, the execution map will show you things the output alone never could.
Your agents were always doing something between the prompt and the response. Now you can see what.

Jono Nourse